
How many people are in a crowded room? How many berries are in a bowl? How many dots flashed on a screen for half a second? In many situations, an exact count is either unnecessary or impossible. Instead, the mind produces an answer such as “about 30,” “roughly 100,” or “somewhere near 20.”
This is numerical estimation: making an approximate judgment about how many items are present without completing an exact sequential count. The final estimate may feel like one immediate sense of quantity, but several sources of information can contribute to it. Approximate magnitude, grouping, density, spacing, item size, total occupied area, viewing time, prior reference values, and strategy can all influence the response.
That is why numerical estimation should not be treated as a pure readout of the Approximate Number System. The ANS is a proposed representational system. Estimation is an observable task with a final numerical response, and that response may combine several processes before a person says “about 40.”
Quick Answer
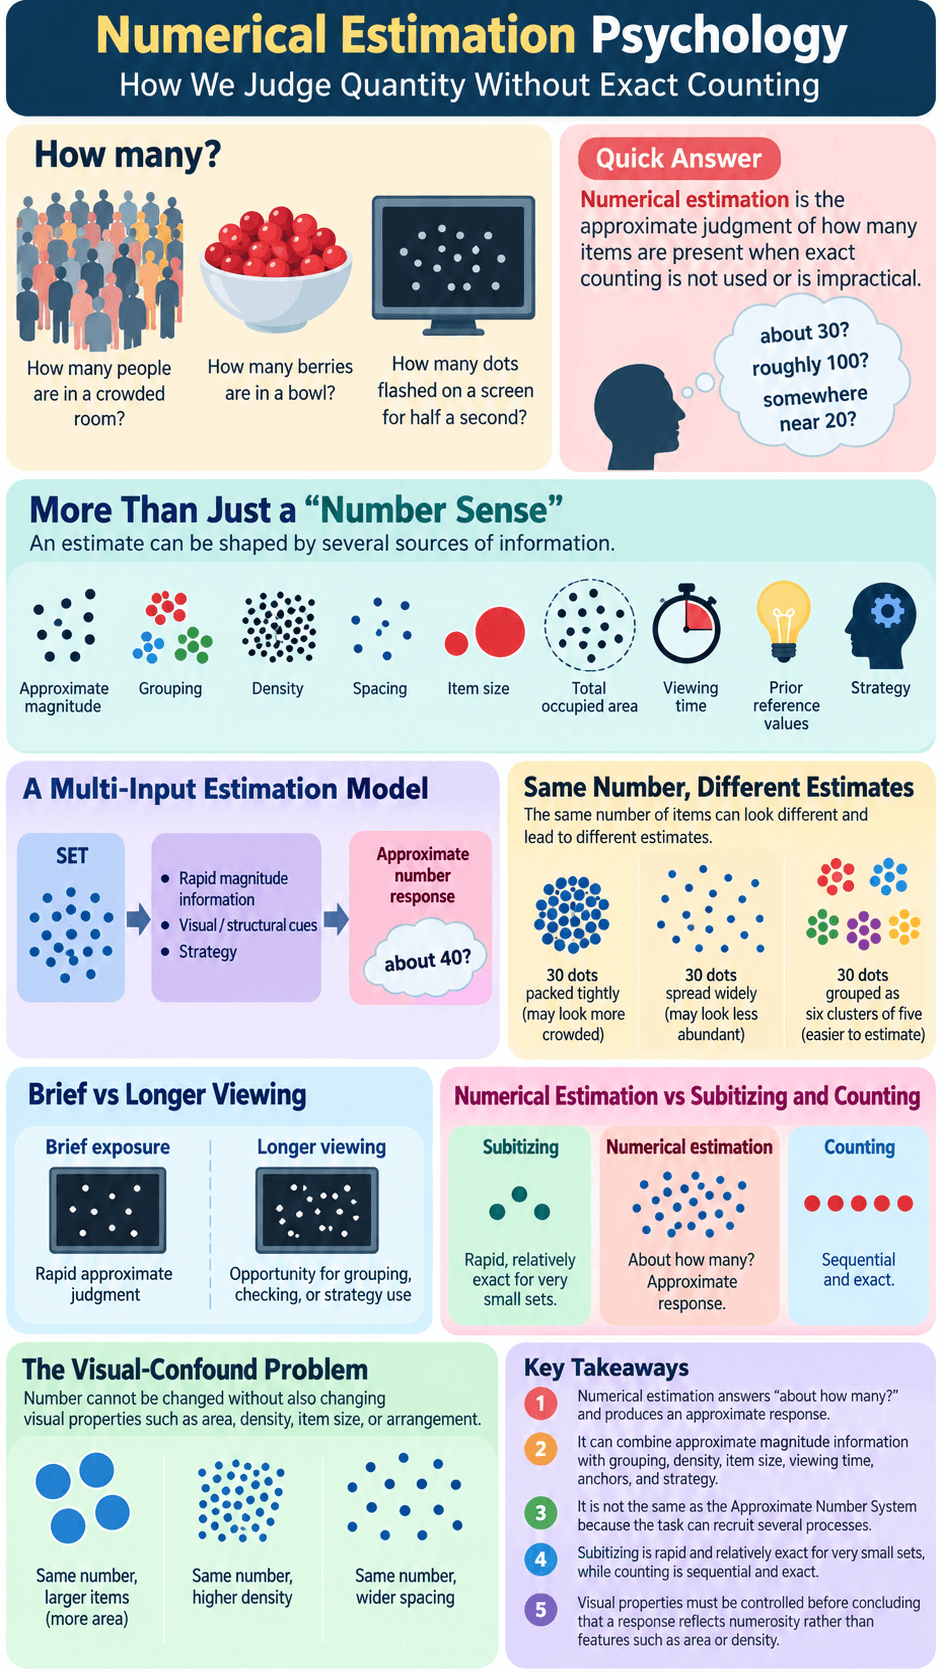
Numerical estimation is the approximate judgment of how many items are present when exact counting is not used or is impractical. An estimate can draw on approximate magnitude information, but grouping, density, spatial arrangement, item size, viewing time, anchors, response format, and learned strategies can also shape the answer. It differs from subitizing, which is rapid and relatively exact for very small sets, and counting, which is sequential and exact.
What Numerical Estimation Means
The question “About how many are there?”
Numerical estimation answers a practical quantity question: about how many? The response is numerical, but it does not claim exact cardinality. If a jar actually contains 63 beads, answers such as 55, 60, or 70 may all represent attempts to estimate the same set.
The task is different from merely deciding which of two sets is larger. “Which side has more dots?” requires a relative comparison. “How many dots were there?” requires the observer to translate an internal quantity impression into an approximate number response.
That translation step matters. A person may perceive one array as clearly more numerous than another while still having difficulty assigning an explicit estimate such as 47. Numerical estimation therefore includes both quantity representation and response production.
Approximate response rather than exact sequential enumeration
Counting produces an exact total by tracking items and pairing them with an ordered number sequence. Estimation gives up some precision to provide a faster or more practical answer.
When a display is brief, counting may be impossible. When a set is very large, counting may be too slow. In everyday life, exactness may also be unnecessary. If you are deciding whether there are roughly enough chairs for a group, an estimate can be more useful than an item-by-item count.
An approximate response is not simply an incorrect count. It is a different kind of judgment with different goals and tolerances.
A Multi-Input Estimation Model
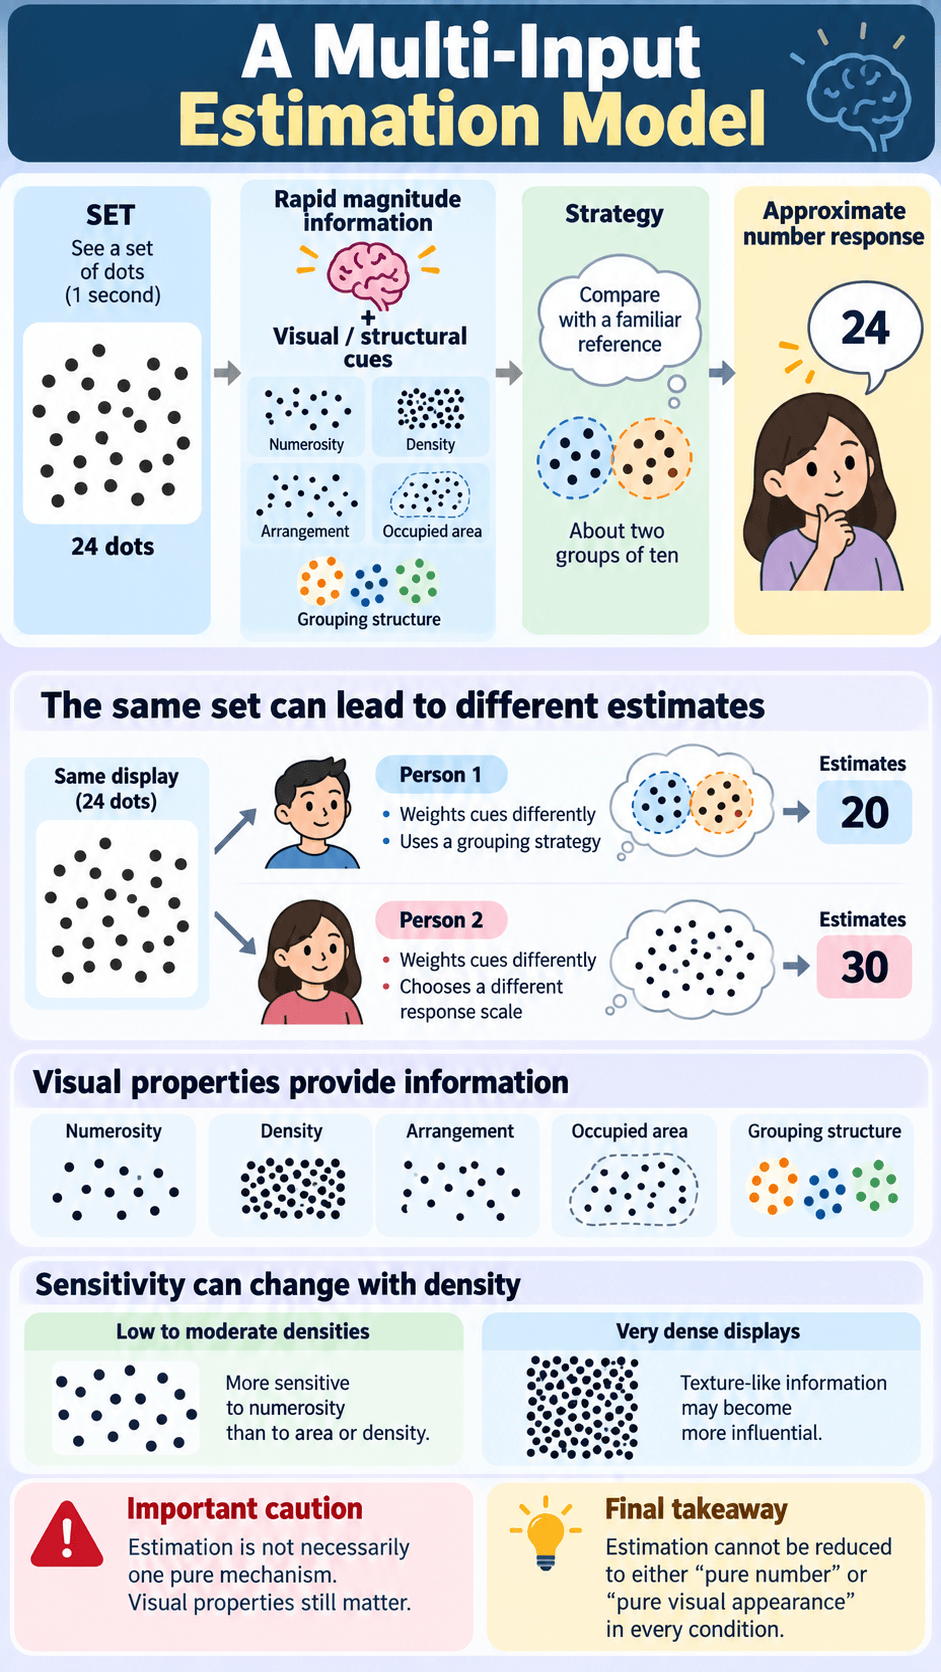
SET → rapid magnitude information + visual / structural cues + strategy → approximate number response
A useful model is:
SET → RAPID MAGNITUDE INFORMATION + VISUAL / STRUCTURAL CUES + STRATEGY → APPROXIMATE NUMBER RESPONSE
Imagine seeing 24 dots for one second. The display provides information about numerosity, but it also has a particular density, arrangement, occupied area, and grouping structure. You may perceive several obvious clusters. You may compare the set with a familiar reference such as “about two groups of ten.” Finally, you must convert that combined impression into a number you are willing to report.
This model explains why two people can view the same set and produce different estimates without either person simply “failing to sense number.” They may weight cues differently, use different grouping strategies, or choose different response scales.
Why estimation is not necessarily one pure mechanism
Research on numerosity perception has long debated whether number is sensed directly or derived partly from continuous visual information such as density and area. Evidence suggests that people can be highly sensitive to numerosity itself, especially when items are individually distinguishable, but visual properties still matter.
An open-access study of spontaneous numerosity perception found that observers at low to moderate densities were more sensitive to numerosity than to area or density, while very dense displays appeared to recruit more texture-like information. This is a useful reminder that estimation cannot be reduced to either “pure number” or “pure visual appearance” in every condition.
What Information Can Influence an Estimate?
Grouping and spatial organization
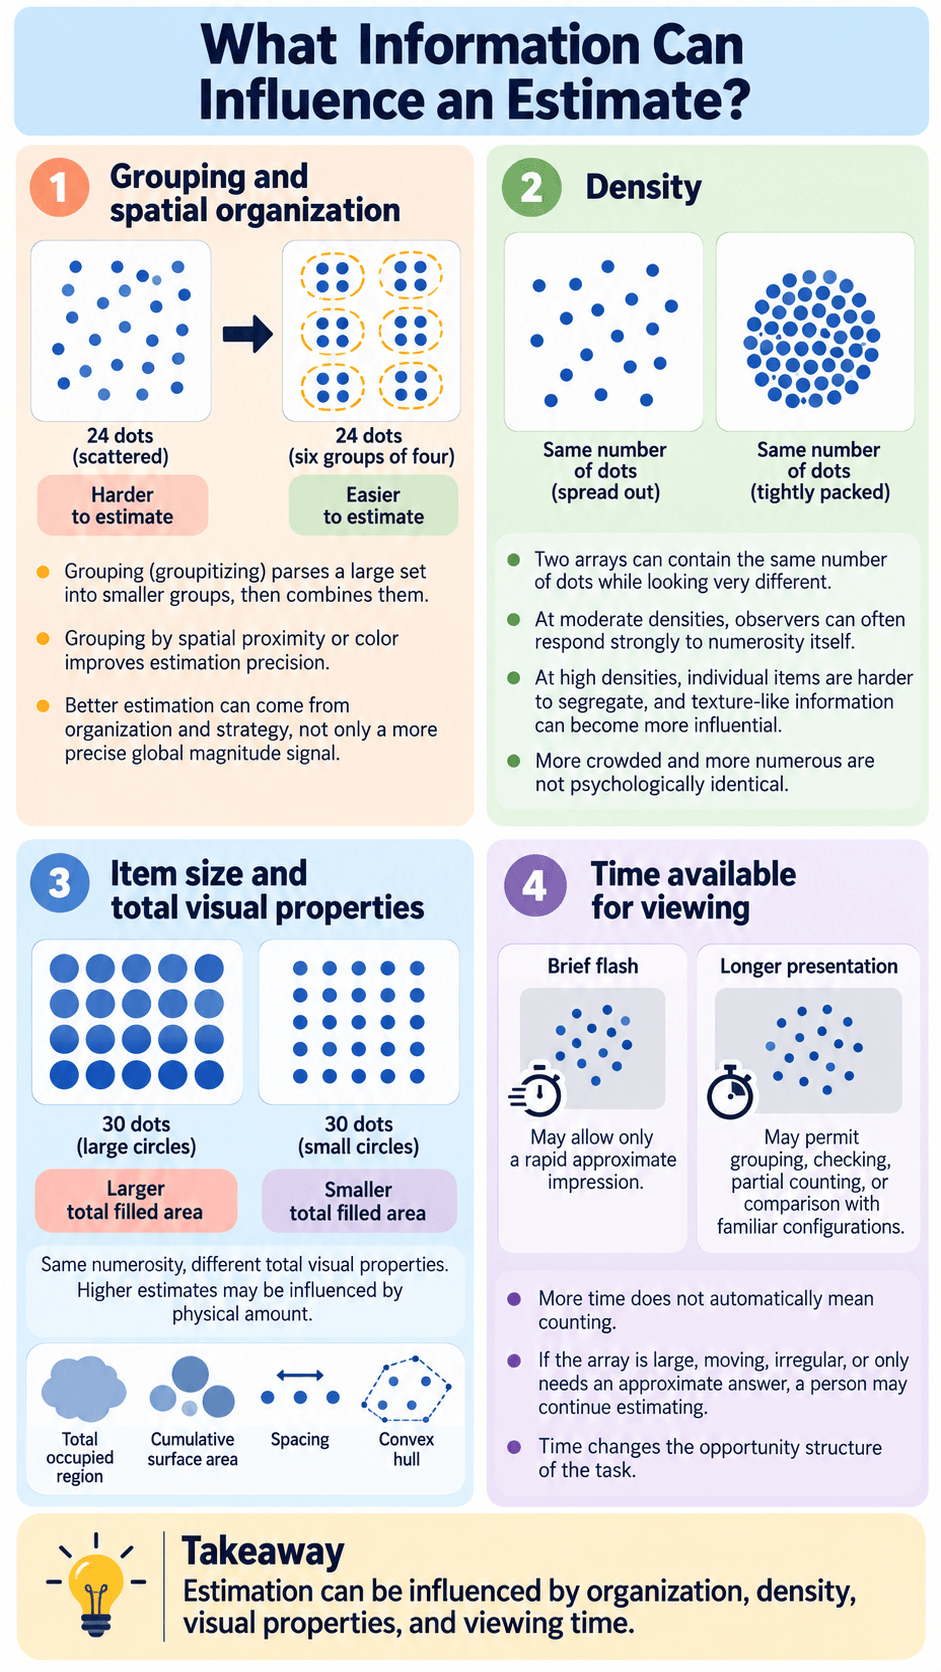
Twenty-four objects scattered randomly may be harder to estimate than the same 24 objects arranged in six obvious groups of four. Grouping changes the structure available to the observer even though the true numerosity is identical.
One useful strategy is to parse a large set into smaller groups that are easier to recognize, then combine those groups. Researchers call the performance advantage created by such grouping groupitizing.
A study of groupitizing in numerosity estimation found that grouping by spatial proximity or color improved estimation precision, in some conditions substantially. The result is important because it shows that better estimation can arise from organization and strategy, not only from a more precise global magnitude signal.
Density
Density describes how tightly items are packed into an area. Two arrays can contain the same number of dots while looking very different if one is tightly packed and the other widely spread.
At moderate densities, observers can often respond strongly to numerosity itself. At high densities, however, individual items become harder to segregate, and texture-like information can become more influential.
This means “more crowded” and “more numerous” are not psychologically identical. A dense display can feel more abundant even when the item count is controlled, while a very spread-out display can look less concentrated despite containing the same number.
Item size and total visual properties
Suppose one 30-dot array uses large circles and another uses tiny circles. The larger circles create more total filled area, even though numerosity stays constant. If the larger-looking display receives higher estimates, physical amount may be influencing the numerical judgment.
The same problem applies to total occupied region, cumulative surface area, spacing, and convex hull. Whenever the number of visible objects changes, at least some physical properties of the display tend to change with it.
An open-access paper on visual numerosity estimation describes this fundamental confound: manipulating the number of items inevitably alters some nonnumerical properties, which makes stimulus control central to interpreting estimation experiments.
Time available for viewing
Viewing time changes the strategies that are possible. A brief flash may allow only a rapid approximate impression. A longer presentation may permit grouping, checking, partial counting, or comparison with familiar configurations.
More time does not automatically mean that every observer begins counting. If the array is large, constantly moving, irregular, or only needs an approximate answer, a person may continue estimating even when more time is available.
Time therefore changes the opportunity structure of the task rather than mechanically switching one process into another.
Brief Exposure vs Longer Viewing
Rapid approximate judgment
A short exposure is often used experimentally to prevent serial counting. If 40 dots appear for only a fraction of a second, the observer cannot realistically point to each item and assign a count word.
The response must rely on information available rapidly. Approximate magnitude is an obvious contributor, but display structure can still matter. Grouping, density, and item arrangement are visible immediately and may shape the initial impression.
This is why a brief presentation is not automatically a “pure ANS” condition. It removes one major strategy, serial counting, but does not remove visual organization or all other strategies.
Opportunity for grouping, checking, or strategy use
Longer viewing opens additional routes. A person may divide the set into regions, estimate one region and multiply, recognize repeated clusters, compare the display with a known reference, or count a subset and extrapolate.
For example, a tray may contain five visually distinct rows. Instead of estimating all objects globally, the observer may estimate one row as roughly eight and calculate that five rows contain about forty.
The final answer is still an estimate if the underlying row estimate was approximate or if not every item was counted exactly. Longer viewing therefore expands the strategy menu rather than guaranteeing exact enumeration.
Anchors, Reference Values, and Response Scaling
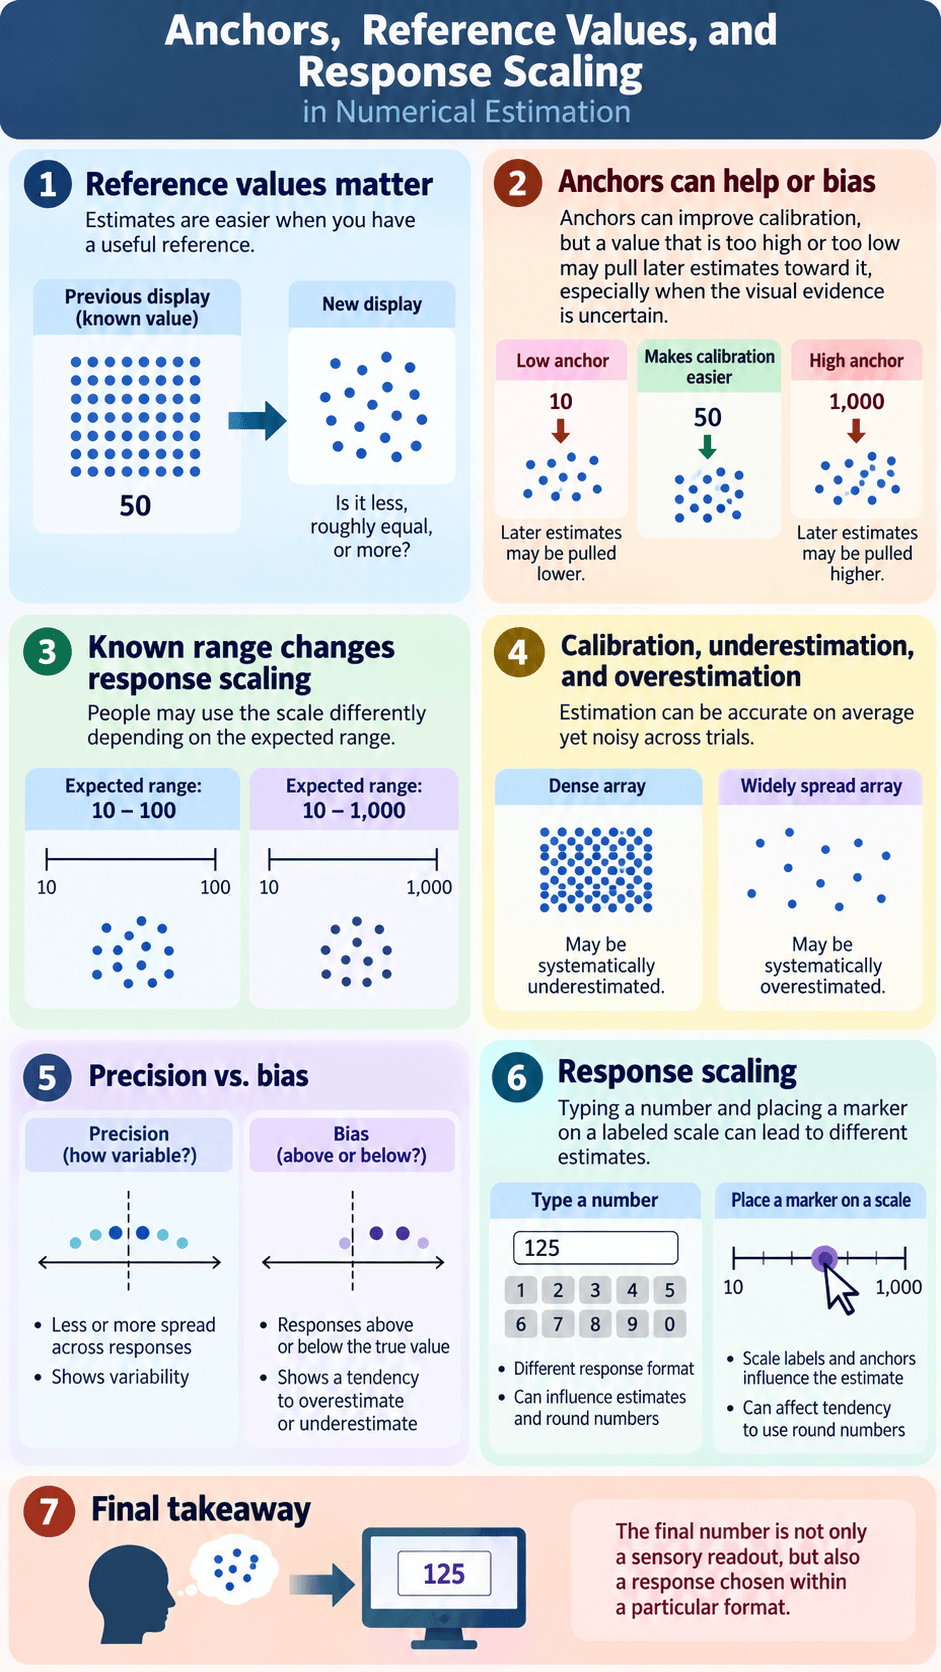
When task-specific reference values matter
Estimates are easier to produce when the observer has a useful reference. If you know that a previous display contained exactly 50 dots, a new display can be judged as clearly less, roughly equal, or somewhat more.
Reference values can improve calibration, but they can also bias responses. An anchor that is too high or too low may pull later estimates toward it, especially when the visual evidence is uncertain.
In experimental tasks, the known range also matters. If participants are told that displays contain between 10 and 100 items, they may use the response scale differently than if they expect a range from 10 to 1,000.
Calibration, underestimation, and overestimation
An estimate can be accurate on average while still being noisy from trial to trial. It can also show systematic bias. A person may consistently underestimate dense arrays or overestimate widely spread arrays, depending on the display and strategy.
Calibration asks whether reported numbers track actual numbers appropriately across the range. It is not only a question of whether one answer was close.
This distinction helps explain why estimation quality has more than one dimension. Precision concerns how variable responses are. Bias concerns whether responses systematically fall above or below the true quantity.
Response scaling
The way people are asked to answer can change the distribution of their estimates. Typing a number into a box is different from placing a marker on a scale with labeled endpoints.
Research on numerical estimation outside pure dot-array tasks shows that response formats, scale labels, and anchors can influence the values people report. An open-access study of response formats in numerical estimation found that scale design and anchors affected estimation behavior and the tendency to use round numbers.
The broader lesson applies to numerosity estimation too: the final number is not only a sensory readout. It is also a response chosen within a particular format.
Numerical Estimation vs ANS
ANS as a proposed approximate representation system
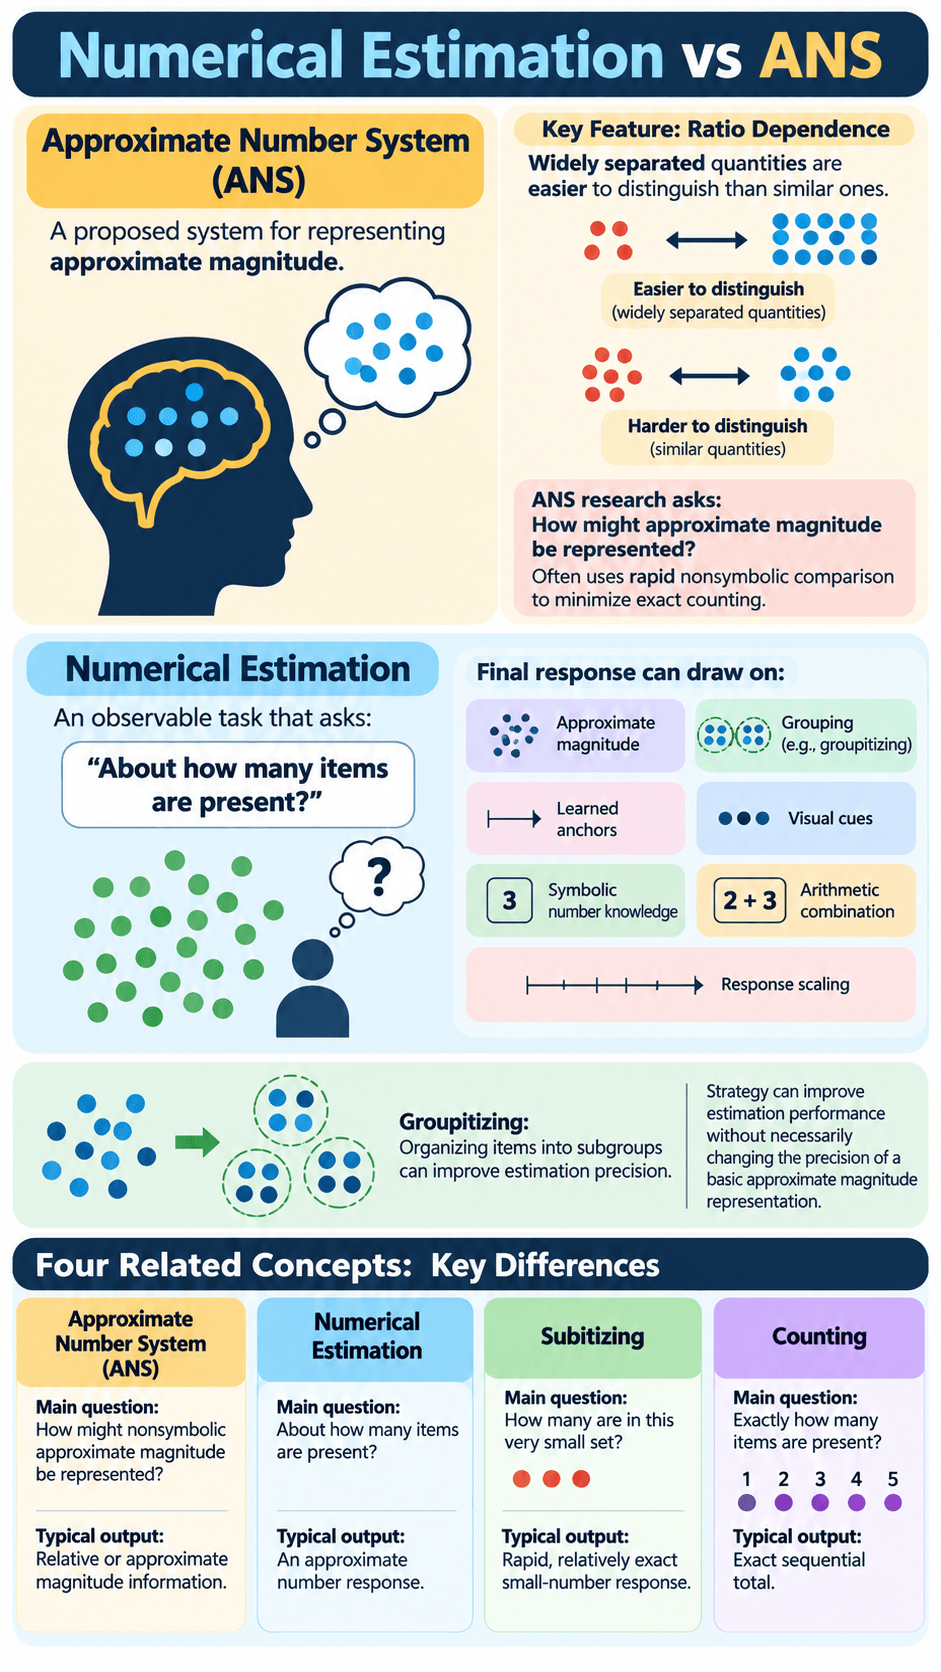
The Approximate Number System is a theoretical construct proposed to represent nonsymbolic numerical magnitude approximately. In comparison tasks, its performance is often described through ratio dependence: widely separated quantities are easier to distinguish than similar ones.
ANS research asks how approximate magnitude is represented. It often uses rapid nonsymbolic comparison because that task minimizes exact counting.
Estimation as an observable task that can recruit several processes
Numerical estimation asks for an explicit approximate number. That final response may draw on approximate magnitude, but it can also recruit grouping, learned anchors, visual cues, symbolic number knowledge, arithmetic combination, and response scaling.
This distinction is important because a person can improve an estimation task through strategy without necessarily changing the precision of a basic approximate magnitude representation.
The groupitizing research is a clear example. Organizing items into subgroups can improve estimation precision because the observer can parse and combine smaller sets. Better performance therefore does not uniquely identify a more precise ANS.
| Concept | Main question | Typical output |
|---|---|---|
| Approximate Number System | How might nonsymbolic approximate magnitude be represented? | Relative or approximate magnitude information |
| Numerical estimation | About how many items are present? | An approximate number response |
| Subitizing | How many are in this very small set? | Rapid, relatively exact small-number response |
| Counting | Exactly how many items are present? | Exact sequential total |
Numerical Estimation vs Subitizing and Counting
Small relatively exact enumeration
If three objects appear and the answer “three” is available almost immediately, that resembles subitizing. The response is fast but relatively exact.
Calling this estimation can blur an important distinction. Estimation tolerates approximation. Subitizing typically identifies a very small set with high accuracy without serial counting.
Sequential exact enumeration
If you need the exact number of 17 visible objects and deliberately track each one while assigning an ordered number word, you are counting.
Counting can be slow, but its goal is exact cardinality. The process requires keeping track of which items have already been enumerated and maintaining the count sequence correctly.
Approximate quantity judgment
If the same 17 objects appear briefly and you answer “about 20,” you are estimating. The goal is a useful approximation, not an exact total.
Everyday behavior can mix these processes. You might subitize several small groups, add them approximately, and then report an estimate. The final output can still be approximate even when some components were represented exactly.
The Visual-Confound Problem
Area, density, item size, and arrangement
Visual numerosity is unusual because number cannot be changed without changing something about the physical display. Add dots to a fixed region and density rises. Keep density constant while adding dots and the occupied region expands. Keep total filled area constant and individual dots may need to become smaller.
Researchers therefore vary these dimensions carefully so that one visual property cannot always provide the correct answer.
The goal is not to remove vision from a visual number task. That would be impossible. The goal is to determine whether the behavior tracks numerosity beyond the obvious nonnumerical features that co-vary with it.
Why estimation should not be described as numerosity-only unless controls support that claim
Suppose participants give higher estimates to arrays with larger occupied area. That finding could reflect numerical processing, area-based bias, or an interaction between the two. Without proper controls, calling the result “pure number perception” would overstate the evidence.
At the same time, visual-confound concerns should not be used to claim that numerosity is never perceived directly. The spontaneous-numerosity study cited earlier found stronger sensitivity to number than area or density at moderate display densities.
The more accurate conclusion is conditional: numerosity can be a strong perceptual dimension, while the contribution of nonnumerical features depends on density, stimulus design, and task demands.
Strategy and Experience
Learned grouping or reference strategies
Experience can change how a person approaches an estimation task. Someone may learn to divide a display into quarters, estimate one region, and scale up. Another person may search for familiar groups such as fives or tens.
Grouping research demonstrates how powerful these strategies can be. An additional study of grouping strategies in number estimation found that structured grouping can extend rapid enumeration performance beyond the usual small-set range by allowing observers to combine subgroups.
The important point is not that one strategy is universally best. It is that estimation accuracy can depend on how the observer organizes the problem.
Why strategy use can vary across tasks
A strategy that works for neat rows may fail for randomly scattered dots. Grouping by color is useful only when color creates informative clusters. Estimating one region and multiplying assumes the regions are reasonably similar.
People can also change strategy when the display duration changes. A fast global estimate may be the only option during a brief flash, while a longer display supports more deliberate parsing.
This variability is another reason to treat numerical estimation as a task with multiple possible routes rather than one fixed mechanism.
Three Same-Number Displays That Can Produce Different Estimates
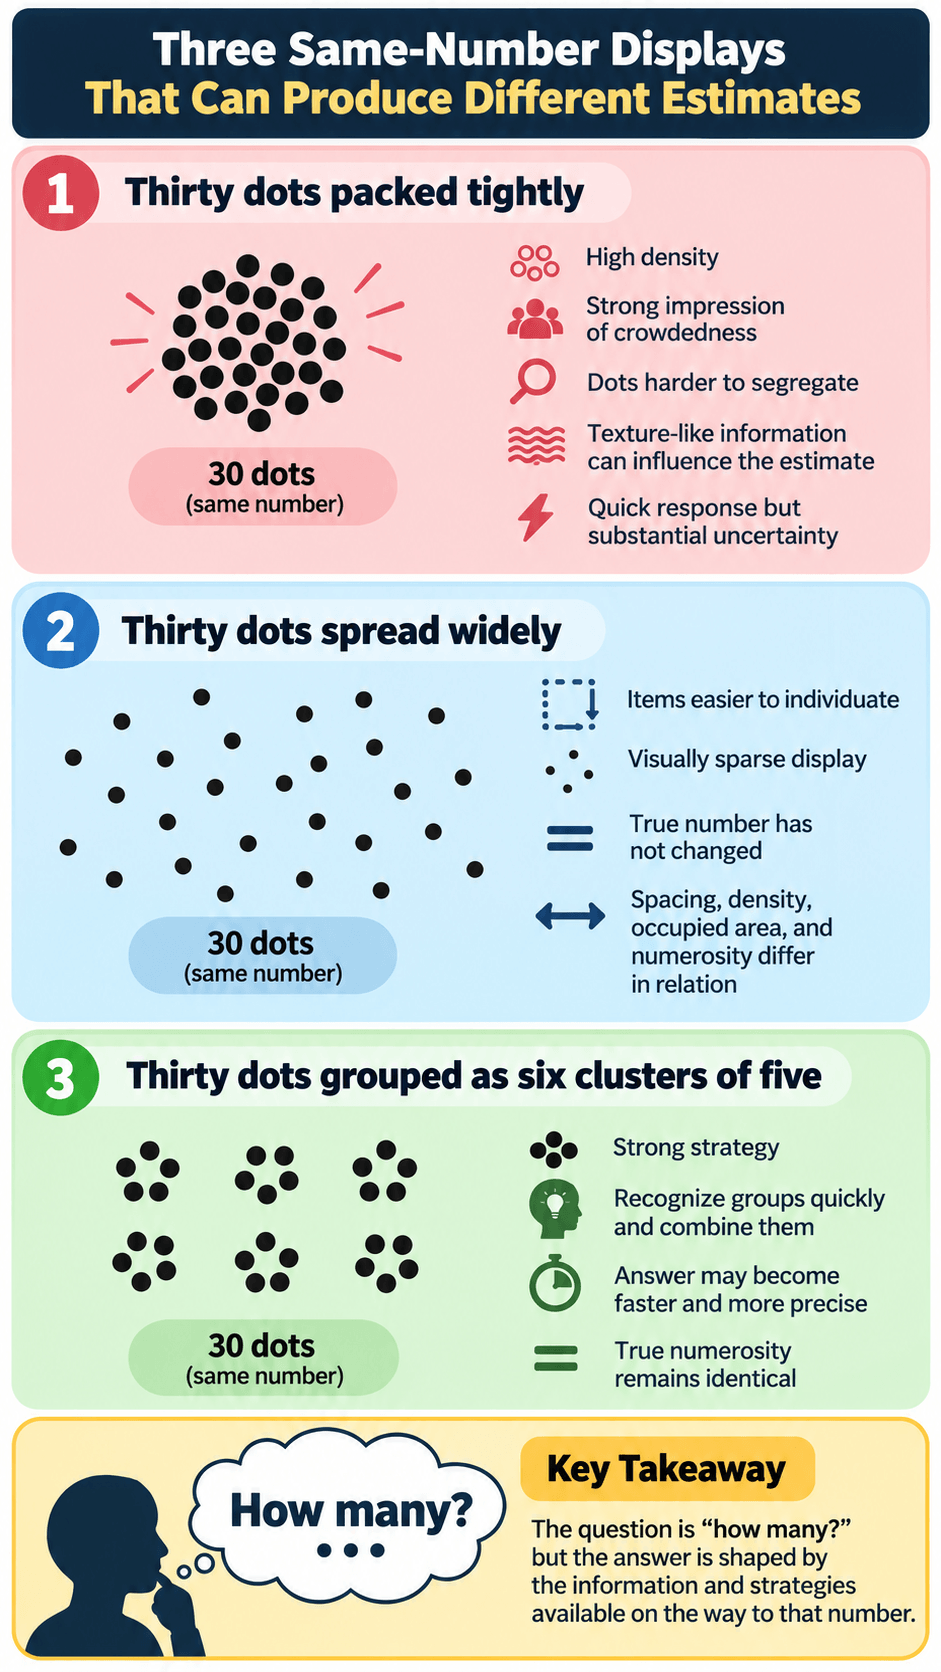
Thirty dots packed tightly
Imagine 30 small dots confined to a compact region. The high density may create a strong impression of crowdedness. If individual dots become difficult to segregate, texture-like information can influence the estimate.
A person may respond quickly but with substantial uncertainty because the display feels like a dense mass rather than 30 easily distinguishable objects.
Thirty dots spread widely
Now keep the numerosity at 30 but distribute the dots across a much larger area. The items are easier to individuate, but the display may look visually sparse.
The true number has not changed. What changed is the relationship among spacing, density, occupied area, and numerosity. Comparing the two displays shows why appearance and number cannot be assumed to move together perfectly.
Thirty dots grouped as six clusters of five
Finally, organize the same 30 dots into six visible groups of five. This structure offers a strong strategy. The observer may recognize the groups quickly and combine them rather than estimating all 30 items as one undifferentiated set.
The answer may become both faster and more precise even though the true numerosity remains identical across all three displays. A recent 2025 study of part-whole effects in visual number estimation adds to evidence that grouping and scene structure can systematically influence numerosity judgments.
This three-display example captures the central lesson of numerical estimation psychology: the question is “how many?”, but the answer is shaped by the information and strategies available on the way to that number.
FAQ
Is numerical estimation the same as the ANS?
No. The Approximate Number System is a proposed representational system for approximate nonsymbolic magnitude. Numerical estimation is an observable task in which a person reports about how many items are present. Estimation can use approximate magnitude information, but it can also involve grouping, visual cues, anchors, arithmetic combination, and response strategies.
Is estimating a small set the same as subitizing?
Not usually. Subitizing refers to rapid and relatively exact enumeration of a very small set without obvious serial counting. Estimation produces an approximate response. A quick answer of exactly three to a clear three-item display is better described as subitizing than estimation.
Why can two layouts with the same number feel different?
Density, spacing, item size, occupied area, and grouping change the visual structure even when numerosity stays constant. These properties can influence how easily individual items are segregated and which strategies become available, which can shift the final estimate.
Does more viewing time always turn estimation into counting?
No. More time makes counting, grouping, and checking more possible, but people may still estimate when the set is large, irregular, moving, or only requires an approximate answer. Viewing time changes available strategies rather than forcing one process.
Does poor estimation diagnose dyscalculia or low intelligence?
No. Estimation performance depends on display design, visual processing, task familiarity, strategy, attention, response format, and many other factors. A single estimation task cannot diagnose dyscalculia, intellectual disability, or another condition and should not be used as a standalone measure of intelligence or mathematical potential.
Key Takeaways
- Numerical estimation answers “about how many?” and produces an approximate rather than exact cardinal response.
- An estimate can combine approximate magnitude information with grouping, density, spatial arrangement, item size, viewing time, anchors, and response strategy.
- Numerical estimation is not the same as the Approximate Number System because the task can recruit several processes beyond approximate magnitude representation.
- Subitizing is rapid and relatively exact for very small sets, while counting is sequential and exact; estimation trades some precision for speed or practicality.
- Visual properties must be controlled before an experiment can claim that a response reflects numerosity rather than correlated features such as area or density.
- Estimation accuracy is not a diagnostic test or intelligence score, and better performance can sometimes reflect strategy or grouping rather than a single underlying “number sense.”

Michael Reed is the Founder and Lead Writer at Psychology Exposed. He writes about human behavior, relationships, emotional patterns, self-awareness, and practical psychology topics using research-informed, easy-to-understand content.
Read More About Michael Reed: https://psychologyexposed.com/michael-reed/