

A few striking examples can make a relationship feel obvious. You hear about two project failures involving the same department, notice several rule violations by fans of one team, or repeatedly see unusual stories tied to one neighborhood. Soon the mind may begin treating the pairing as a pattern, even when the full evidence does not support a strong relationship.
Psychologists call this kind of error an illusory correlation. The central issue is not simply that one event is memorable. It is that two categories become mentally linked, and the perceived link can feel more frequent or more diagnostic than it really is. Understanding that difference helps people check impressions without assuming that every group difference is imaginary or that every memorable example is meaningless.
Quick Answer

Illusory correlation is the perception of a relationship between two categories or events that is absent, weaker, or different from what the evidence supports. In social judgment, a distinctive group and a distinctive behavior can become especially memorable when they occur together. The practical correction is to compare rates, denominators, non-events, and equivalent comparison groups before turning a striking pairing into a broad conclusion.
What Illusory Correlation Means
Correlation means that two variables vary together in some systematic way. The APA Dictionary of Psychology describes covariation as a relationship in which values of two variables change together. Illusory correlation concerns a mismatch between that relationship and the relationship a person perceives. Within the broader psychology of prejudice and stereotyping, illusory correlation is one possible mechanism that can distort group impressions without explaining every stereotype.
Perceiving a relationship that is absent or weaker than believed
Suppose a company has two departments. Department A has 80 employees and Department B has 20. During a quarter, eight people from A and two people from B miss an important deadline. If someone remembers the two cases from B more vividly and concludes that B is especially unreliable, the impression ignores the fact that both departments had the same 10 percent rate.
The mind does not always calculate proportions automatically. Vivid combinations and memorable stories may stand in for the full data. A real event can therefore support an inaccurate relationship judgment: the event happened, but the claimed strength of the group link may not follow.
Why an actual correlation must be evaluated rather than assumed away
Calling a possible association “illusory” should not become a reflexive way to dismiss evidence. Sometimes two variables really are associated. A sports league may have different penalty rates across teams in one season. Departments may differ in turnover. Neighborhoods may differ on a measured outcome because of local conditions, selection effects, resources, or other causes.
The responsible question is whether the claimed relationship survives a fair comparison. That means examining how many opportunities there were for the behavior to occur, how often it did not occur, whether the groups were observed under similar conditions, and whether the evidence is large and representative enough to support the conclusion.
The Distinctive Pairing Mechanism
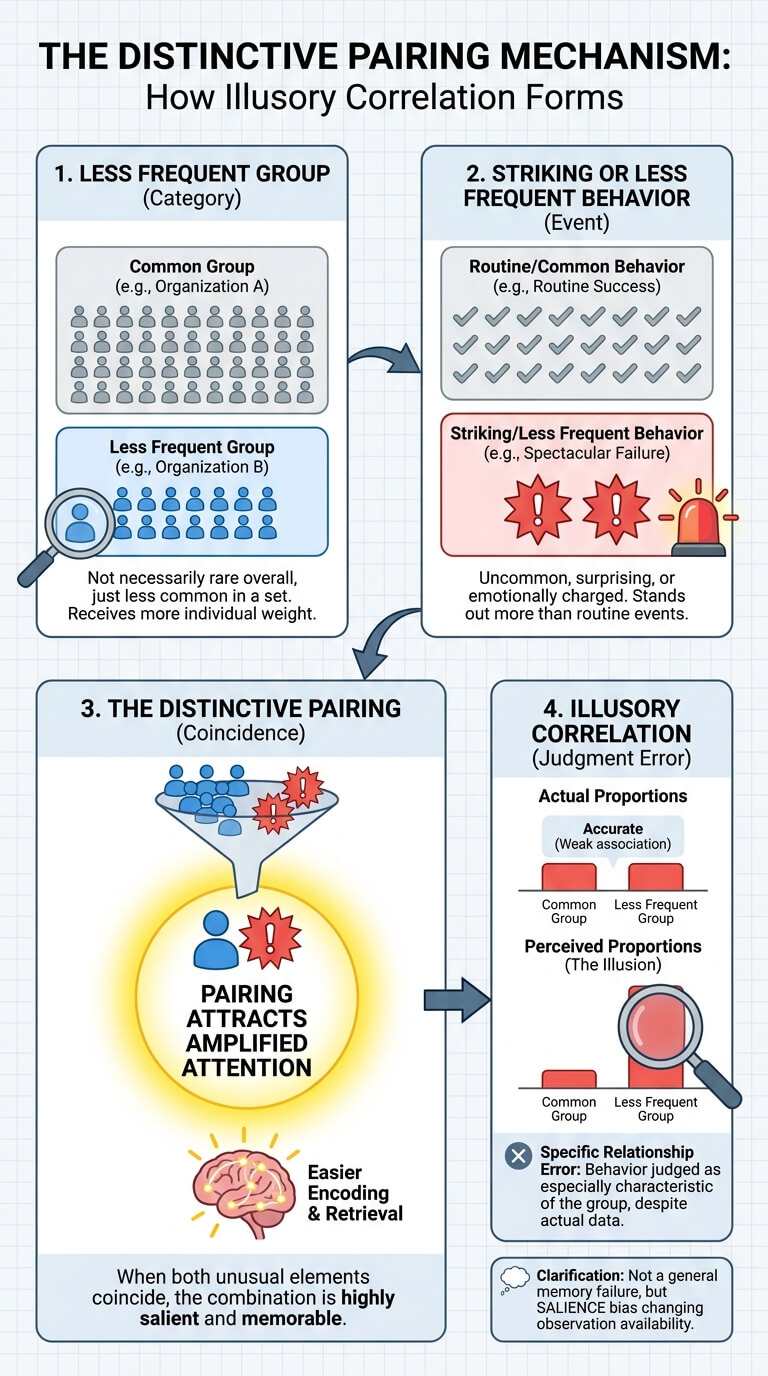
A classic explanation for illusory correlation focuses on distinctiveness. Events that are unusual attract attention. When two unusual things occur together, their pairing may receive even more attention than either would alone.
A less frequent group or category
In a set of observations, one group may simply appear less often. That does not mean it is rare in the wider world. If you read 30 profiles from Organization A and 10 from Organization B, B is merely the less frequent category in that information set, so each example may carry more weight in the impression that forms.
A less frequent or striking behavior
Some behaviors also stand out because they are uncommon, surprising, emotionally charged, or inconsistent with what usually happens. A spectacular failure is easier to notice than twenty routine successes. A bizarre rule violation receives more discussion than ordinary compliance. Distinctive behavior does not have to be negative, although negative events often attract attention strongly.
Why the combination attracts attention
When a less frequent category and a less frequent behavior coincide, the combination has two reasons to stand out. Attention can make that pairing easier to encode and easier to retrieve later. The result may be a judgment that the distinctive behavior is especially characteristic of that group, even when the actual proportions do not support the conclusion.
This is a specific relationship error, not a general claim that memory is unreliable. Memory is often useful, but salience changes which observations are most available when a person later estimates frequency or association.
The Classic Group-Impression Paradigm
The best-known social-psychology demonstration comes from David Hamilton and Robert Gifford. In their 1976 experiments, participants read favorable and unfavorable behaviors attributed to members of two groups that differed in size.
Hamilton and Gifford’s basic design
In the original work, one group appeared more frequently than the other, and favorable behaviors appeared more frequently than unfavorable behaviors. Crucially, the ratio of favorable to unfavorable behaviors was arranged so that the smaller group was not objectively more negative.
Yet participants tended to overestimate the association between the smaller group and the less frequent undesirable behaviors. The original Hamilton and Gifford study framed this as a cognitive basis through which stereotypic impressions could emerge even when the presented proportions did not justify the perceived difference.
Equal behavior proportions across differently sized groups
The design matters because raw counts can be misleading. A larger group can produce more total examples of a behavior simply because there are more members. A smaller group can produce fewer examples yet still look more strongly associated with the behavior if those examples are disproportionately memorable.
To judge the relationship fairly, compare proportions. If 4 of 20 people in one group and 12 of 60 in another show the same behavior, both rates are 20 percent. Remembering “four cases from the small group” does not make the small group more associated with the behavior.
Why the historical result matters and what it does not prove
The study became influential because it showed one route from ordinary information processing to exaggerated group impressions. It did not show that every stereotype begins this way or that distinctiveness is the only mechanism. Later work has tested attention, learning, memory, comparison, and judgment accounts. A meta-analytic integration by Mullen and Johnson found a reliable distinctiveness-based effect while also identifying factors that changed its strength.
Memorable Pairing to Perceived Frequency
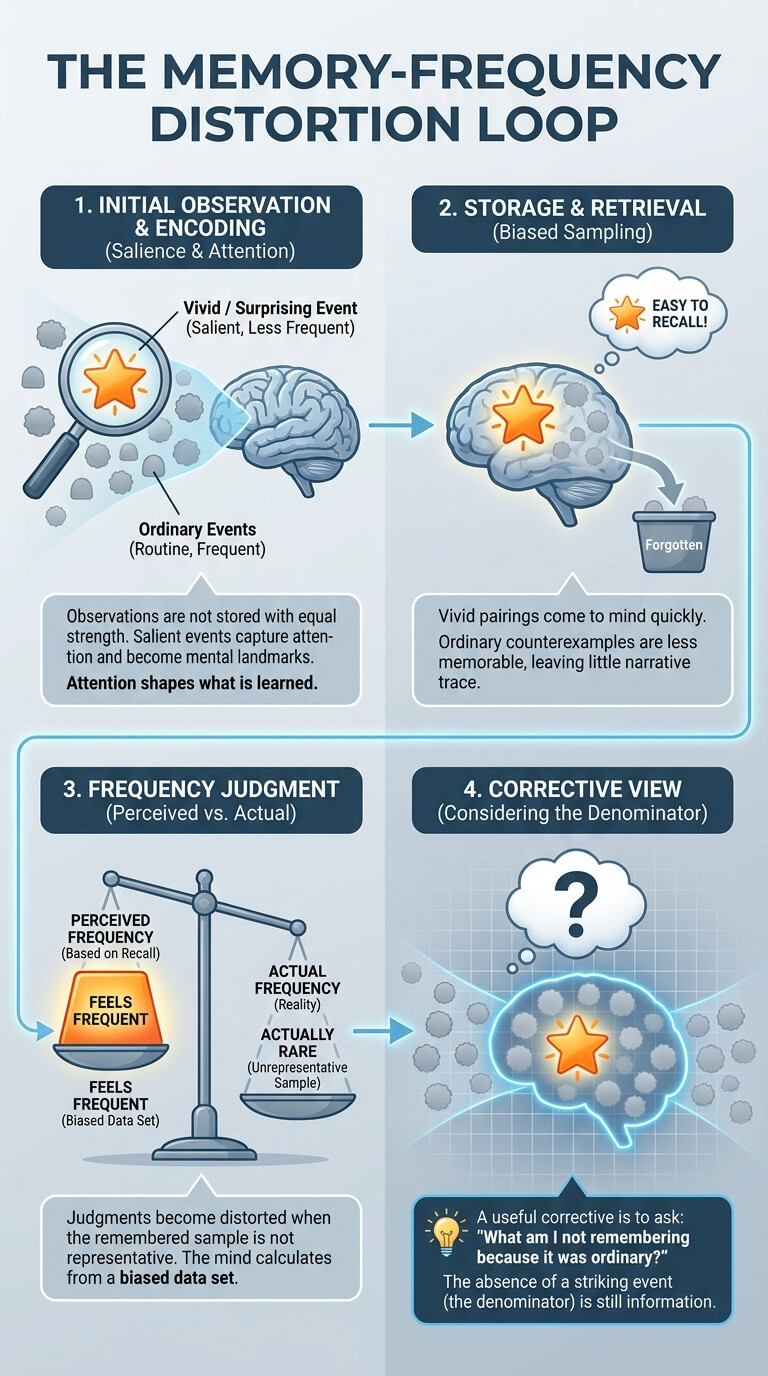
The practical problem begins when memory is treated as a frequency counter. Observations are not stored with equal strength. Surprising, vivid, or category-distinguishing events may receive more mental emphasis.
Salience and encoding
Salient information is more likely to capture attention. In a long series of ordinary events, one unusual event can become a mental landmark. If that landmark is attached to a category that is itself less frequent or newly salient, the pairing may be encoded as especially informative.
Research has continued to examine attention as one route to stereotype formation. Sherman and colleagues tested an attentional model that accounted for both exaggerated real differences and perceived differences absent from the data, showing how attention allocation can shape what is learned from group information.
Retrieval and remembered examples
Later, a person may ask, “Which group did I see doing that?” The vivid pairing comes to mind quickly. If the ordinary counterexamples are less memorable, recall feels like evidence that the relationship itself was frequent.
Anecdotes can therefore feel more persuasive than denominators. A vivid story is easy to replay, while routine cases in which nothing unusual happened leave little narrative trace even though they matter for estimating a rate.
How perceived frequency can drift from actual frequency
Frequency judgments become distorted when the remembered sample is not representative of the observed sample. If two incidents are remembered and eighteen non-incidents are forgotten, the mind is effectively calculating from a biased data set.
A useful corrective is to ask, “What am I not remembering because it was ordinary?” The absence of a striking event is still information. People who did not violate the rule, projects that did not fail, and encounters that were uneventful all belong in the denominator.
Expectations Can Shape Interpretation Too
Distinctive pairings are not the whole story. Existing expectations can affect what a person notices, how ambiguous behavior is interpreted, and which details seem worth remembering. This matters because perceived correlation can be produced or strengthened at several stages, from learning to later judgment.
Prior beliefs change what feels noteworthy
If someone already expects a particular organization to be disorganized, a late response from one member may feel confirming. A similarly late response from another organization may be treated as an individual mistake. The same event can receive different psychological weight depending on the expectation surrounding it.
Prior beliefs do not always override evidence, but they provide context for interpreting it. A broader look at how beliefs shape interpretation helps explain why confirming events can feel more diagnostic than equivalent disconfirming events.
Ambiguous behavior may be coded differently depending on expectation
Many social behaviors are ambiguous. “Asked many questions” could be coded as curious, cautious, skeptical, or difficult depending on the situation. If a category expectation is already active, ambiguous behavior may be labeled in a way that makes the apparent association stronger.
That is why careful comparison uses behavior that is defined as consistently as possible. If one group’s assertive comment is counted as “aggressive” while another group’s similar comment is counted as “confident,” the apparent difference may partly reflect inconsistent coding rather than a true behavioral difference.
Illusory Correlation vs Availability Heuristic
These concepts overlap, but they answer different questions. Availability concerns how easily examples come to mind. Illusory correlation concerns how strongly two variables or categories are believed to be related.
Ease of recall versus inferred relationship
| Question | Availability | Illusory correlation |
|---|---|---|
| What feels important? | Events that come to mind easily can feel common or likely. | A pairing can feel like evidence that two categories belong together. |
| Core judgment | Frequency, probability, or importance. | Strength of association between two variables. |
| Example | After hearing several vivid stories of project failure, failure feels common. | Because several vivid failures involved Team B, Team B feels especially linked with failure. |
How availability can contribute without being identical
An easily recalled pairing may help create an illusory correlation, but ease of recall alone is not enough to define one. You could overestimate how common deadline failures are without linking them to any group. Conversely, you could infer a group-behavior relationship through comparison processes even when recall is not the only mechanism.
For a wider overview of shortcuts and systematic judgment tendencies, cognitive biases and common examples provides the broader context. The key here is narrower: whether two things seem to covary more than the evidence warrants.
Illusory Correlation vs Stereotyping
An illusory correlation is a possible mechanism. A stereotype is a broader generalized belief, expectation, or association about members of a category. Confusing the two makes it harder to see where a belief came from and how strongly it is supported.
Mechanism versus broader belief structure
Imagine someone concludes that members of a hobby group are unusually unreliable after noticing a few memorable cancellations. The perceived relationship between group membership and cancellation is the illusory-correlation question. If that conclusion becomes a generalized expectation applied to unfamiliar members, it begins functioning as a stereotype.
Stereotypes can also arise through teaching, repeated language, media patterns, norms, role expectations, and overgeneralized real differences. Illusory correlation is one possible ingredient, not a complete theory. Another distinct group-perception effect is outgroup homogeneity, which concerns how similar members of another group appear rather than whether two categories seem statistically associated.
Why one exaggerated association can become a stereotype ingredient
Once a pairing becomes mentally established, later information may be filtered through it. Confirming cases feel expected and relevant. Exceptions may be dismissed as unusual individuals. Over time, a weak association can acquire the subjective feel of a stable group characteristic.
The most useful interruption is not to argue that categories never matter. It is to ask whether the particular expectation is supported by enough comparable evidence to justify applying it to a new person.
Base Rates, Denominators, and Comparison Groups
The fastest way to weaken a misleading impression is often to convert a story into a rate. That requires looking beyond the numerator, the number of memorable cases, to the denominator, the total number of relevant opportunities.
Count both the behavior and non-behavior cases
If three members of a club break a rule, ask how many club members were observed. Three out of six is different from three out of six hundred. Also count members who had the same opportunity and did not break the rule. Non-events are quiet, but they carry statistical information.
Compare rates, not just memorable counts
Suppose 6 of 30 people in Group A and 12 of 120 people in Group B make the same mistake. Group B has twice as many mistakes in raw count, but its rate is lower: 10 percent compared with 20 percent. Without denominators, “B had more mistakes” sounds like stronger evidence than it is.
The APA Dictionary’s entry on the base-rate fallacy describes a related problem in which background rates are ignored or underweighted. Illusory correlation is not identical to base-rate neglect, but checking base rates is an effective way to test whether a perceived association survives fuller information.
Ask what happens in the reference group
A group-behavior claim is incomplete without a comparison. “Four people from Department X missed the deadline” tells you almost nothing about whether Department X differs from Department Y if you do not know how many people were in each department, how many deadlines were assigned, and how often Y missed them under comparable conditions.
Comparison groups should also be reasonably equivalent. Comparing first-year trainees in one group with senior staff in another would mix group membership with experience. The apparent association might disappear once the conditions are matched.
A Five-Step Evidence Check for Memorable Pairings

When a group-behavior link feels compelling, use a short sequence before accepting or rejecting it. The aim is calibrated confidence, not forced skepticism.
1. Write down the claim
Turn a vague impression into a testable sentence. “They are unreliable” is too broad. “Members of Group B miss scheduled handoffs more often than members of Group A” identifies the behavior and comparison that would need evidence.
2. Identify numerator and denominator
Count the events, then count the opportunities. If you remember five violations, ask out of how many observations. If only one group has been watched closely, recognize that surveillance itself can generate more recorded incidents.
3. Compare equivalent groups or conditions
Ask whether both groups faced similar rules, exposure, workload, incentives, and observation. A meaningful rate comparison needs roughly comparable opportunities for the outcome to occur and be noticed.
4. Look for disconfirming instances
Search deliberately for cases that do not fit the association: members of the focal group without the behavior, and members of the comparison group who do show it. These cases test whether memory has overrepresented one pairing.
5. Update confidence rather than forcing certainty
The result may be “the association is weaker than I thought,” not “there is no association.” If the sample is small, selected, or poorly measured, uncertainty is more accurate than certainty or denial.
| Fast impression | Evidence question |
|---|---|
| “I keep hearing about this group doing X.” | How many distinct cases are there, and how many total opportunities? |
| “Most examples I remember involve Group B.” | Am I also counting ordinary cases from B and comparable cases from A? |
| “The pattern feels obvious.” | Would the rates still differ if I wrote the full sample in a table? |
| “There must be something about that group.” | Have I established a correlation, and separately, have I established a cause? |
Repeated Anecdotes and the Illusion of Statistical Commonness
Modern information environments add another complication: repetition can look like independent evidence. The same unusual incident may be reposted, summarized, quoted, discussed, and shown from several angles until it feels like many separate cases.
Why repetition can feel like prevalence
Repeated exposure increases familiarity with a story. Familiarity can make the event easier to retrieve, which may increase its subjective weight when judging a category. A person may sincerely remember seeing “this kind of thing everywhere” even though many exposures trace back to a handful of original events.
Repeated reports should not be ignored, but exposure frequency is not occurrence frequency. Before inferring a group pattern, count unique cases whenever possible.
Why multiple retellings may still trace back to a small sample
Imagine one unusual confrontation involving a sports fan is clipped into six videos, covered by five accounts, and discussed for a week. Someone who encounters twelve pieces of content may experience twelve retrieval cues for one event. If they later estimate how often fans from that group behave that way, media repetition can inflate the apparent sample.
A useful check is provenance: “How many independent observations are behind what I have seen?” Online, copying and commentary can multiply much faster than new events.
Edge Cases: When the Association Is Real
Not every uncomfortable pattern is an illusion. Sometimes careful data show a genuine association. The next task is to interpret that association without overreaching.
Distinguish observed correlation from causal explanation
A reliable relationship does not automatically tell you why it exists. Training, selection, role requirements, exposure, reporting practices, or other variables may contribute. Moving from “these variables differ together” to “group membership causes the behavior” requires additional evidence.
This is where the distinction from causal explanations in attribution psychology becomes useful. Detecting a pattern and explaining its cause are separate reasoning tasks.
Check measurement quality and relevant comparison groups
Ask who was observed, how behavior was defined, whether the same criteria were used, and what cases were missing. Greater visibility, heavier monitoring, or unequal exposure can change recorded counts. Stronger evidence uses consistent definitions, comparable opportunities, adequate samples, and transparent denominators.
Do not generalize a group-level association to every individual
Even an accurate group-level difference is probabilistic. It does not tell you that a specific person has the group-average trait or will perform the average behavior. Individual evidence should carry more weight as soon as it becomes available.
If one department has a 15 percent delay rate and another has a 10 percent rate, most people in both departments still did not delay. Treating every person in the first department as unreliable would convert a modest aggregate difference into an unjustified individual prediction.
Everyday Neutral Examples
Neutral cases make the reasoning easier to inspect because the mechanism is not hidden by emotionally loaded group labels. The same evidence check can later be used when the categories are socially consequential.
Departments and project failures
Situation: Two memorable launches involving the analytics team fail. What someone may feel: that analytics involvement predicts failure. What it may mean: the failures were vivid and analytics was involved, but the person has not counted successful launches involving the same team. What to do next: compare failure rates across all projects with similar complexity and identify other contributing conditions.
Sports groups and rule violations
Situation: Several clips show supporters of one club breaking stadium rules. What someone may feel: that the club’s supporters are uniquely disorderly. What it may mean: distinctive incidents are more likely to be filmed and shared than ordinary behavior. What to do next: compare unique incidents, crowd size, observation period, enforcement, and rates across comparable clubs.
Neighborhood stories and rare events
Situation: A person hears three unusual stories connected to one neighborhood and starts treating the area label as predictive of residents’ behavior. What they may feel: that repetition confirms a local pattern. What it may mean: the stories may be memorable, duplicated, or drawn from a selective sample. What to do next: separate unique events from retellings and avoid using area-level anecdotes as evidence about an individual resident.
How Illusory Associations Can Feed Stereotypes

When an exaggerated pairing is repeated, it can become a generalized expectation. The mind moves from “I remember several cases of X with this category” to “X is characteristic of this category.” That shift turns a relationship judgment into a broader belief about people.
Repeated pairings become generalized expectations
Once the expectation is established, future examples may be interpreted through it. Confirming cases attract attention because they fit the anticipated relationship. Disconfirming cases may seem ordinary or be explained away. This feedback can make the original belief feel increasingly self-evident even if its empirical foundation was weak.
General group expectations are explored more broadly through social psychology and group behavior. Here, the narrower lesson is that a perceived statistical relationship can become one building block of a generalized impression.
Individual evidence should still override a broad category inference
Whether the initial association was false, exaggerated, or partly accurate, person-level judgment should use person-level evidence whenever it is available. A category may suggest a question worth asking, but it should not replace observation of the individual.
Notice the category-based prediction, identify what evidence supports it, and keep it provisional. If the person’s behavior contradicts the group expectation, update the judgment rather than preserving the belief by labeling that person an exception.
FAQ
These questions help separate a vivid impression from what the evidence actually supports.
Is every group-behavior association an illusory correlation?
No. Some group-level associations are real in a particular sample or context. Illusory correlation refers to a perceived relationship that is absent, exaggerated, or otherwise mismatched with the evidence. The correct response is not to assume “illusion” whenever a group difference is uncomfortable. Check rates, measurement, comparison groups, uncertainty, and alternative explanations.
How is illusory correlation different from availability bias?
Availability concerns how ease of recall affects judgments of frequency or probability. Illusory correlation concerns an inferred relationship between two variables or categories. A vivid group-behavior pairing may be highly available and therefore help strengthen an illusory correlation, but the concepts are not interchangeable.
Why are rare combinations especially memorable?
One influential account is that two distinctive features occurring together attract extra attention and become easier to retrieve later. Research has also proposed learning, comparison, and judgment-based explanations, so distinctiveness should not be treated as the only possible mechanism. More recent work continues to debate exactly where the error arises. A review of the origin of illusory correlations contrasts memory-based and base-rate-based explanations.
Can accurate statistics still be misapplied to individuals?
Yes. A group average or group-level rate is not a personal diagnosis or prediction. Even when one group has a somewhat higher average on a measured outcome, there may be extensive overlap between groups. Once individual information is available, it should usually carry much more weight than a broad group estimate.
What is the fastest way to check a suspected illusory correlation?
Write the claim in measurable terms, count unique cases, identify the denominator, and compare the same rate in a relevant reference group. Then look for non-events and disconfirming cases. If the sample is too small or incomparable, reduce confidence rather than forcing a yes-or-no conclusion.
Key Takeaways
- Illusory correlation is a mismatch between a perceived relationship and the relationship supported by the available evidence.
- Distinctive group-behavior pairings can receive extra attention and become disproportionately memorable.
- Raw counts are often misleading. Rates require both a numerator and a denominator, plus a meaningful comparison group.
- Availability and illusory correlation can interact, but ease of recall is not the same as perceiving that two categories covary.
- A genuine group-level association still does not establish its cause or justify assuming that every individual matches the group average.
- When a memorable pairing feels diagnostic, the best next step is to inspect the full sample and update confidence in proportion to the evidence.
Final Thoughts
Illusory correlation psychology explains how a true memory can support a false conclusion. A real incident can become too influential when the quieter denominator disappears from view.
The next time a group-behavior link feels obvious, write down the rate you believe you are seeing and ask what data would calculate it fairly. That shift from memorable pairing to comparable evidence makes room for skepticism and genuine patterns without turning either into certainty too quickly.

Michael Reed is the Founder and Lead Writer at Psychology Exposed. He writes about human behavior, relationships, emotional patterns, self-awareness, and practical psychology topics using research-informed, easy-to-understand content.
Read More About Michael Reed: https://psychologyexposed.com/michael-reed/